Greetings all,
Hopefully this will be a simple question for my fellow Combit users out there.
I’m making a more complex report (which is still pretty simplistic I believe) than I’ve done before, so I’m not sure how to get it to layout and flow properly.
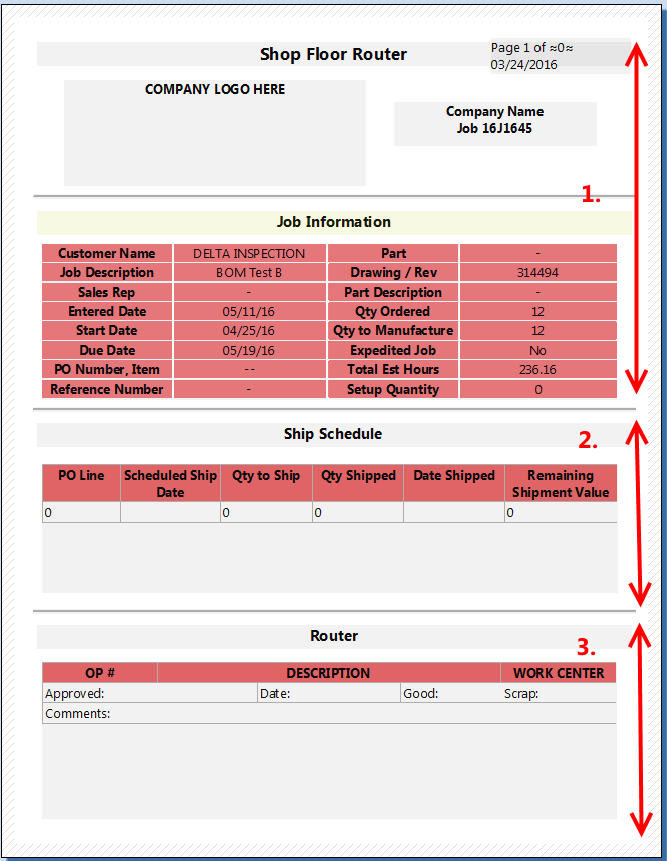
I’ve attached a link that shows a screen capture of the report as I currently have it designed in the Combit report designer. Even without looking at the report, I’ll quickly describe it.
The report is broken in to 3 sections. Section 1 is the header that gives some basic information about a task (the name of the task, hours it is expected to take to complete, the name of the customer, etc…). Section 1 is a fixed size - it consumes about the top 5 inches (~12.7 cm) of the sheet. Right now, everything in Section 1 are basically Combit Text objects with the property set to only show on the first page.
Section 2 and 3 are tables. Section 2 may run long enough to run in to page 2, but typically will be fairly small. Section 3 will often be quite extensive, possibly several pages worth.
Right now when I run the report, the tables stay in their “fixed” position on pages 2 and beyond, instead of just “flowing”. Section 1 correctly does not show up on the top 5" of the pages, but instead it’s just blank space.
By “flowing” I mean I want the table in Section 2 to start right after the fixed length of Section 1, run as long as it takes to output the data (flowing to the top of page 2 if it consumes all of page 1) with section 3 following suit (consuming the entire length of the page).
I imagine I need to use layers to achieve this, but am not fully certain. Should I put Section 2 on it’s own layer, and then Section 3 on it’s own layer?
If you could recommend a chapter or section of the manual, or maybe an included Combit example that does this that should be more than enough to point me in the right direction.