Introduction
This article is intended to help you to find and fix errors and issues on your own. It gives you tips on how to best handle a problem that occurs, how to search for the problem, and what to do in what order. If you still need to contact our technical support team, it will help you make the initial preparations to provide as much information as possible.
A large attention is paid to the so-called debugging. Debugging in our case means to examine your program live for errors during execution. The program “Debwin4” will help you with this. You will find it in the List & Label installation directory in the subfolder “Miscellaneous”. This program logs all operations in a single text file, the so-called log file. In the course of this article you will get an insight into the structure and the contents of the log file. Just as you can find errors in the log file as quickly as possible.
Procedure for Troubleshooting
If a problem is occurring, it’s recommended to follow a certain troubleshooting procedure, here are the steps to take (we’re discussing a further description for each later):
- Check Service Pack Update
- Read Service Pack PDF Documentation
- Search Forum and Knowledgebase
- Creating a Log File With Debwin4
- Analyzing a Log File
- Creating a Dump File
- Contacting Technical Support Team
Check Service Pack Update
Please first check if you already have installed the latest service pack of List & Label. Most problems reported by users/developers are already solved in Service Packs. Therefore, it is recommended to always keep List & Label up to date.
There are two ways to find out which version you’re using. One is using the designer dialog accessible via a shortcut (the other one is analyzing the log file - which we’re getting on later in this article).
Open the List & Label Designer and press <CTRL + SHIFT + F12>. The dialog that opens contains some information about List & Label and your system. The most important information is the version number. You find the current List & Label version and subversion number under “Version”. Additionally, the log file shows which modules are loaded.
You can find an overview of the current Service Packs for your registered products in our support area.
Read Service Pack PDF Documentation
In the support area you will also find a PDF document in which all bug fixes, features and improvements of the Service Pack are documented. Please read this document first. Your problem may already be solved quickly and easily by downloading and installing the Service Pack.
Search Forum and Knowledgebase
If you already have an idea or even know what the cause of your problem is, we recommend to search our Forum and our Knowledgebase for help. Here you will find a articles with tips or solutions to known and frequently occurring problems or maybe other users with the same problem.
Debugging of .NET Applications
Problems occurring on the developer PC can be easily found in most cases. The usual features of the development environment can be used to spot a problem relatively quickly. The first step is to catch any occurring exception and to find their cause (see section “Error Handling With Exceptions” in the Programmer’s Manual).
As a development component List & Label is naturally run under a variety of different constellations on the end user side. To find problems there as easily as possible a dedicated debug tool is available which provides a logging function for problems occurring rarely or only on certain systems so problems can also be examined under systems without a debugger.
Of course the logging function can also be used on the developer PC and provides the possibility to check all calls and return values at a glance as well.
Creating a Log File
If a problem only occurs on one customer system, a log file should first be created on that system. The tool “Debwin”, which is installed in the “Miscellaneous” directory of the List & Label installation, serves this purpose.
Debwin must be started before the application. When the application is started afterwards, all calls to the component with their return values as well as some additional information about module versions, operating system etc. are logged.
Each exception thrown under .NET corresponds to a negative return value of a function in the log. The log usually contains further helpful information.
If the application is supposed to create debug logs without the help of Debwin, debugging can also be activated via the code:
...
using(ListLabel LL = new ListLabel())
{
  LL.Debug = LlDebug.Enabled | LlDebug.LogToFile;
  LL.DebugLogFilePath = @"c:\temp\myLLProtocol.log";
}
...
Custom Logging Mechanisms & Logs in Web Applications
How to implement your own custom logging and what to consider when logging web applications, Windows services and multi-user systems can be found in our separate knowledgebase article Logging if Used as Service / Web Reporting
Creating a Log File With Debwin4
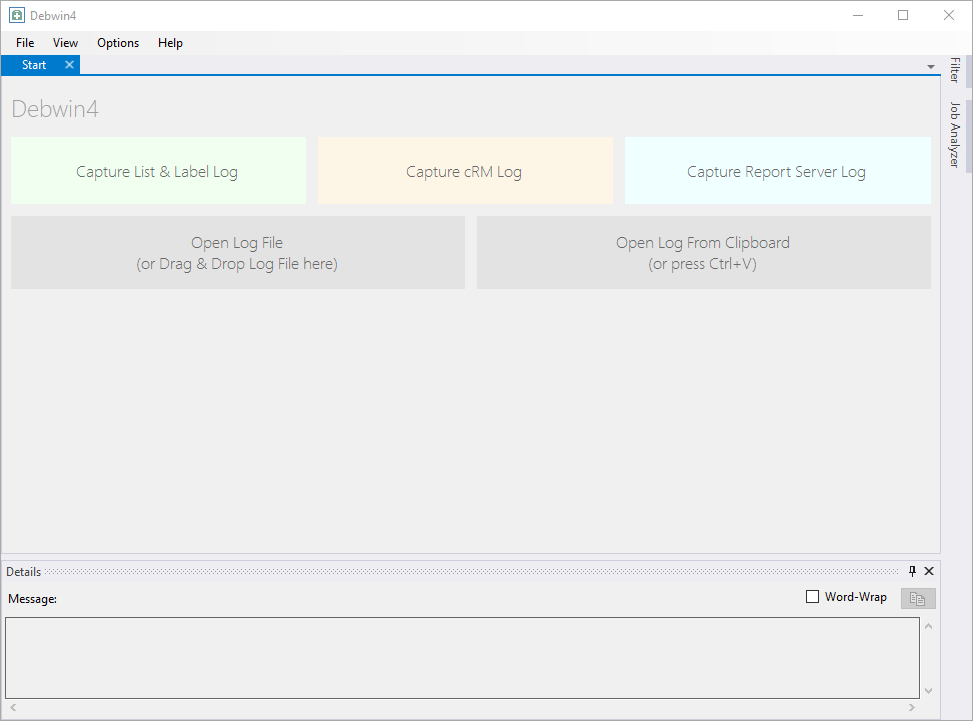
The structure of Debwin4 is kept very simple.
The debug mode does not have to be switched on by LlSetDebug() anymore. To get all output, Debwin must be started before the application to be debugged. As soon as your application is started, the debug output of Debwin is evaluated and printed.
The following options are available:
Capture List & Label Log
Create log file for List & Label.
Capture cRM Log
Create log file for combit Relationship Manager.
Capture Report Server Log
Create log file for Report Server.
Open Log File
Open an existing log file.
Open Log From Clipboard
Open copied log output from the clipboard.
When using Debwin4, the familiar procedure of earlier Debwin versions must be followed:
- Start Debwin4.
- Select “Capture List & Label Log”.
- Start the application and provoke the error behaviour again.
In addition to the error codes, you will receive further information so that you can often find the cause of an unwanted behavior in this way.
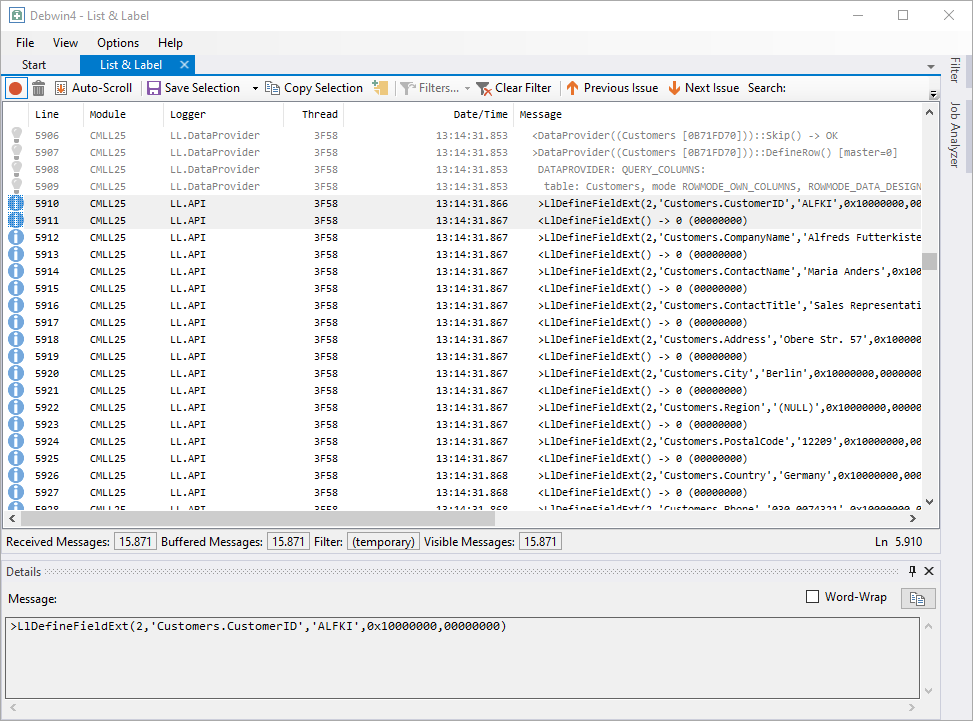
You can see the called module (CMLL25), the logger (LL.API), the thread ID (3F58), timing information (13:14:31.866) and the called function (LlDefineFieldExt(…)) with parameters and - in the following line - the return value of the function (LlDefineFieldExt() → 0):
CMLL25                LL.API                3F58                13:14:31.866        >LlDefineFieldExt(2, 'Customers.CustomerID', 'ALFKI', 0x10000000, 0000000)
CMLL25                LL.API                3F58                13:14:31.867        >LlDefineFieldExt() ->  0 (00000000)
During logging the following functions are available in Debwin4:
Turn Logging on or off
This allows you to pause or resume logging.
Clear All Messages
This will delete all outputs in the current view.
Auto-Scroll
If this option is activated, the focus of the output window is on the last and therefore current debug output.
Save Log
Saves the log file in log4 format.
Copy Log
Copies the debug output to the clipboard.
Add Custom Message
Inserts a note/message into the log file.
Filters
Option to load a saved filter.
Clear Filter
Possibly set filters are reset and all log outputs are displayed.
Previous Issue
Displays the previous error in the log file.
Next Issue
Shows the next error in the log file.
Search
Search in the log file. With function key F3 to the next search hit.
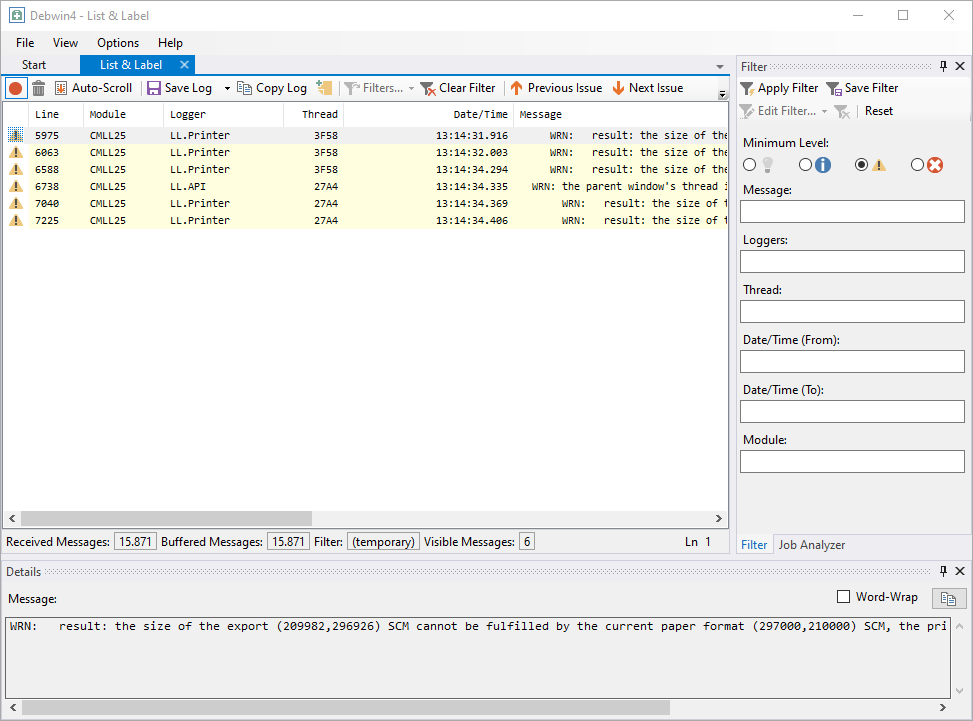
Filter Log File
The filter window allows you to quickly and easily search the log file for specific information or to narrow down the debug output.
Minimum Level
Determines the priority of the output (debug output, information, warning and error).
Loggers
Limitation by logger (LL.API, LL.DataProvider, LL.Export, LL.Generic, LL.Licensing, LL.NetFX, LL.Notification, LL.Printer).
Thread
Restriction according to a specific thread.
Date/Time (From)
Debug output from a certain date/time.
Date/Time (To)
Debug output until a certain date/time.
Message
Specific debug output.
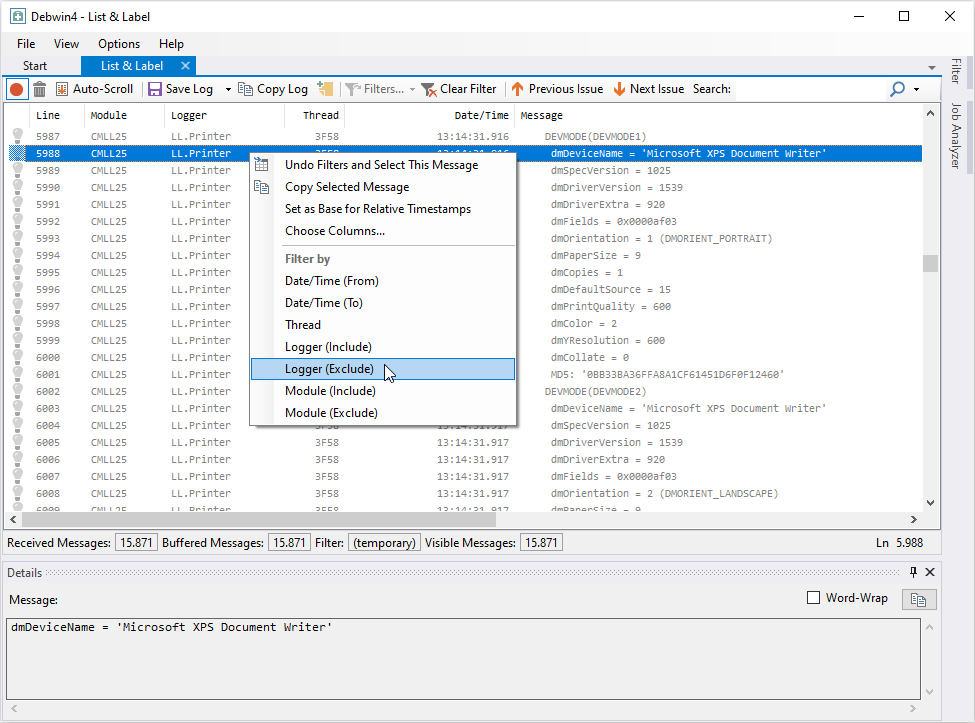
The filters allow the use of several semicolon-separated values. In addition, the filter criteria, e.g. according to a specific thread or different loggers, can be conveniently compiled by the user via the context menu of the output window. Simply click on the respective line and select the thread to include or the logger to exclude:
Tip: The search and filter message allow you to use regular expressions.
Create a Log File Server/Web Applications
To create log files for server/web applications it is necessary to run Debwin4 as administrator (context menu “Run as administrator”) and select “Capture List & Label Log”. Logging in services and web applications is then started automatically.
Analyzing a Log File
General Structure of a Log File
The log files created with Debwin4 generally have the same structure. First the so-called “header” is created. This is followed by the actual debug output, which contains the function calls, return values and any error codes.
Header
The header provides various information about the system, e.g. List & Label version, sub-version (Service Pack Level), language, operating system:
Version                        : 25.2.2020.9400 (20-04-01 00:57)F
SysInfo of                     : 02.04.2020 13:14:22
Application                    : C:\PROGRAM FILES (X86)\COMBIT\LL25\BEISPIELANWENDUNG\DEMOAPPLICATION25.EXE [25.1.0.0]
List & Label                   : C:\PROGRAM FILES (X86)\COMBIT\LL25\REDISTRIBUTION\X86\CMLL25.DLL [25.2.2020.9400 (20-04-01 00:57)F]
Caller                         :
Serial number                  : ********
LL flags                       : DD(0), Debug=DBG: (TMP), INF: (TMP), WRN: (TMP), ERR: (TMP)+LS+IDP
User and system name           : ******** on ********
User Domain                    : ********\********
Keyboard                       : 00000407
Country/Language               : Germany/German (user)
                               : Germany/German (system)
OS version                     : Windows 6.2 (WIN_10 1909 32 bit APP on 64 bit OS) Multiprocessor Free
                               : Emulated OS: Windows 8 (Enterprise), (x86 Processor) v6.2 Build:9200
                               : Underlying OS: Windows 10 (Enterprise), (x64 Processor) v10.0 Build:18363.720, ProductType:0x00000004, (Terminal Services in Remote Admin Mode), (64 Bit Edition), (Multiprocessor Free)
Furthermore, information about the used directories of the TEMP files, e.g. storage location for temporary files during printing, available space on the storage path and a check of the read/write rights (R/W check OK):
Drives available               : C:\;D:\;E:\;H:\;I:\;K:\;N:\;R:\;S:\;U:\;V:\
    Temporaries                :
     GetTempPath()             : C:\Users\********\AppData\Local\Temp\combit\ (hard disk, 223557.0 MB free), R/W check OK
     env(TEMP)                 : C:\Users\********\AppData\Local\Temp (hard disk, 223557.0 MB free)
     env(TMP)                  : C:\Users\********\AppData\Local\Temp (hard disk, 223557.0 MB free)
Additionally, all printers available on the network and the default printer are listed:
Printers                    : 15
                            : 'Send To OneNote 2016': 'Send to Microsoft OneNote 16 Driver' on 'nul:'
							[...]
							: 'PDF-XChange Lite V6': 'PDF-XChange V6 Printer Driver (Lite)' on 'PXC5L'
							[...]
Default printer             : 'Microsoft XPS Document Writer'
Using this header information you can now find out your current List & Label version. This header should always be included in log files for support purposes.
Debug Outputs
As already mentioned, the header is followed by the actual output. Such a line could look like this, for example:
Module
Indicates the responsible List & Label module, in this case cmLL25.dll.
Logger
Identifies the output logger (LL.API, LL.DataProvider, LL.Export, LL.Generic, LL.Licensing, LL.NetFX, LL.Notification, LL.Printer) In this case LL.API.
Thread
Identifies the thread and helps to distinguish between different threads, in this case the thread 3F58.
Date/Time
- Returns the time at which the print job was executed.
- This is important if, for example, there is an unexplained pause of about 30 seconds during the execution of the print job, during which nothing happens.
- In other words, to find the cause, you would first have to locate the line where there is a time jump of 30 seconds.
- Tip Via the menu item Options > Date/Time Format you can directly display the difference between the individual debug output and the previous debug output.
Message
Identifies the currently executed operation, in this case it is the definition LlDefineFieldExt of the field Customers.CustomerID with contents ALFKI with the field type LL_TEXT 0x10000000.
Error Detection
Any errors that occur are relatively easy to track down in the log file. Errors are highlighted in red color in Debwin4 and can be displayed directly by clicking the “Next Issue” button. With “Previous Issue” you jump back to the previous error.
In this case it is a syntax error. The formula used has an error and cannot be interpreted. The string does not end with a ".
Check Return Codes
After each call of a function it is recommended to check the return values to ensure correct execution.
Correct function executions return a value of “0”. All return values less than zero “-??” indicate errors or hints.
Under .NET exceptions are thrown instead of the negative return values. This allows you to catch all possible errors conveniently in a catch block.
Creating a Dump File
You can create the dump file with two different tools, either ProcDump or WinDbg.
ProcDump
With this utility from Microsoft, you can easily monitor process dumps of CPU spikes in applications. The tool also helps you create process images when processes hang or unhandled exceptions occur. You can download the program directly from the Microsoft website.
How to create a ProcDump dump file:
- Start your application.
- Run ProcDump with the following command on the command line:
procdump -accepteula –e –ma <Application>.exe –o %TEMP%\dump.dmp
- Various information about the process is now displayed on the command line.
- Please repeat the steps up to the error.
- ProcDump automatically creates a dump file as soon as the problem occurs.
Windows Debugger WinDbg
With the Windows Debugger WinDbg you can create dump files. You can download the program directly from Microsoft. Either as a stand-alone program or as part of the Windows Software Development Kit (SDK), just check the box “Debugging Tools for Windows” during installation.
How to create your dump file:
- Now start WinDbg via the created start menu entry.
- Start the affected process under the debugger via File > Open Executable.
- Start the debugging via Debug > Go or via the function key F5.
- If the problem occurs, enter the following command on the debugger command line:
.dump /ma c:\temp\combit.dmp
- Confirm the entry. WinDbg will now create the dump file in the specified path.
For detailed instructions on creating dump files, e.g. if the application should “hang”, please refer to our separate knowledgebase article Creating a Memory Dump File.
Contact Technical Support Team
If you are unable to locate the error yourself and need to contact support, it is advisable to provide as much information as possible to the support team in order to solve the problem quickly. Normally the following information (files) are required:
- exact error description (Where does the error occur? At which step of the process?). Our online form helps you to provide the most important information. In addition, the project file (*.lst, *.lsr etc.) + preview file (*.ll) can be sent along, provided the problem is visible there.
and
- if you solve the problem with our “example application” (DemoApplication??.exe), the print template (project file) used there is sufficient for the support team to be able to reproduce the problem. Otherwise a runnable and minimized source code example is necessary. You can use one of our many examples provided or you can reduce your application to the extent that it can be executed by the support without any problems.
If this is not possible, in some cases a log file can help:
- complete log file (with full header showing the printing process up to the actual problem)
The following can also help with crashes or exceptions:
- dump file
IDKBTE000752 KBTE000752


