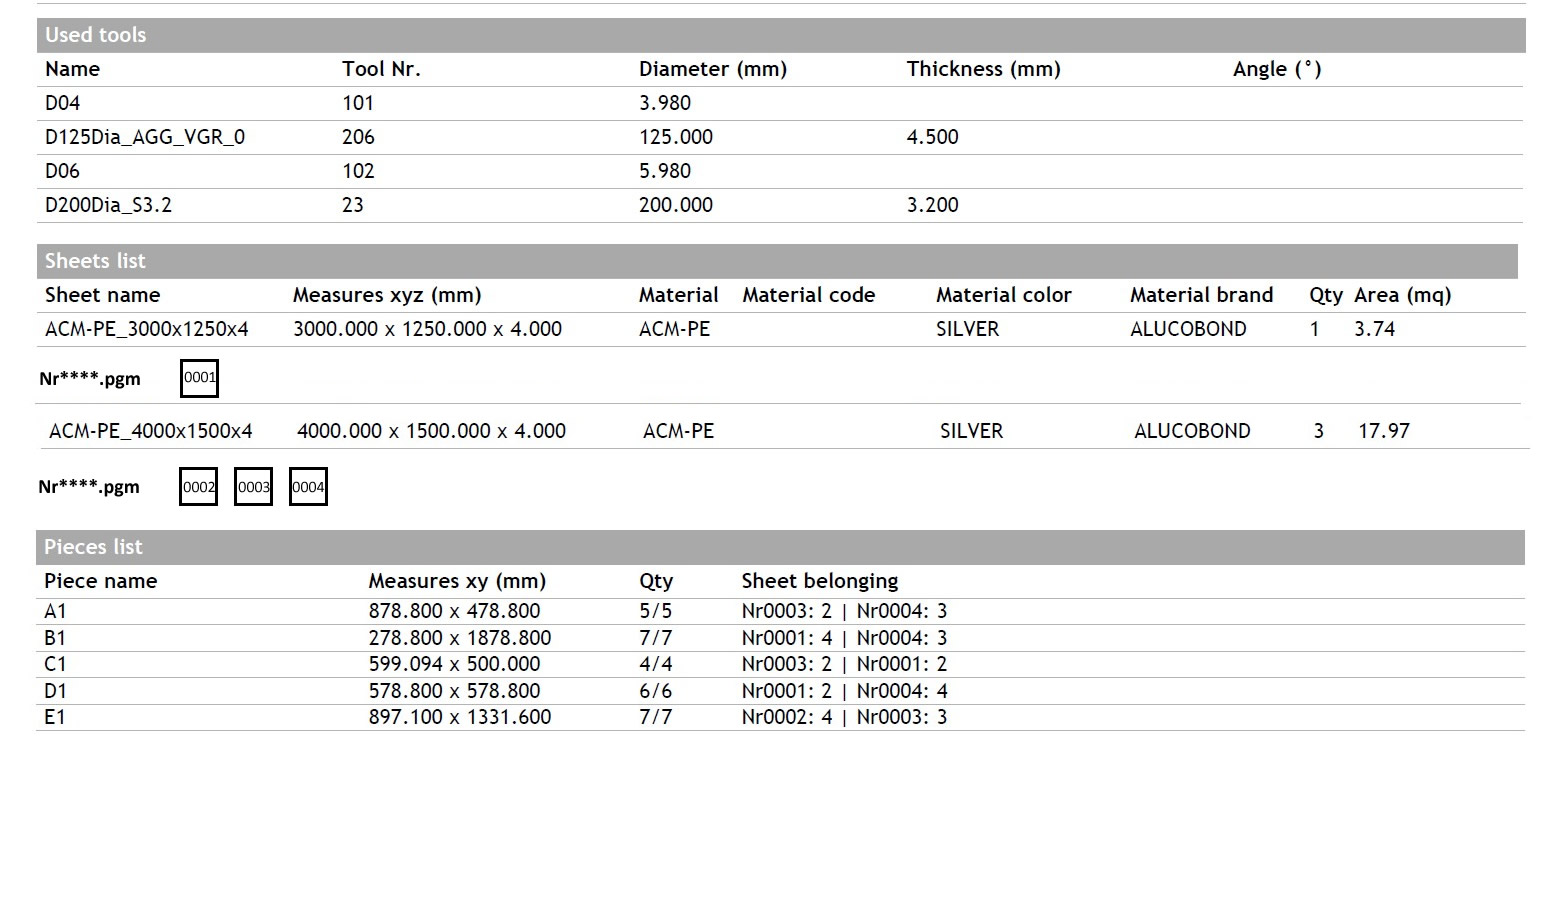
In particular I don’t understand if I can create a table (see sheets list) that shows the elements organized in columns.
The small squares shown in the screenshot, should contain the value of the data rows while the rows should be the groups footer.
When the squares list is too long to be contained in the TableWidth, they should go automatically to new line.
I send you the template in attachments (I don’t know how to send you some sample data to use with the template).
Thank you all for the help,
Greetings again, sorry for the late reply to this suggestion.
I tried with the procedure you linked but I cannot make it work.
As the procedure say I should create a new table and set the column number to a value like 4 for example. But then the result I got is not what I was expecting and I don’t even have the side option "fill horizontally. What am I missing? Still on L&L 25
If possible my final result should be a single header with multiple values on the same line as you can see in the attached picture but with the NXXXX values printed horizontally. And if they’re more than 4 I would like to see them on the second line and so on.
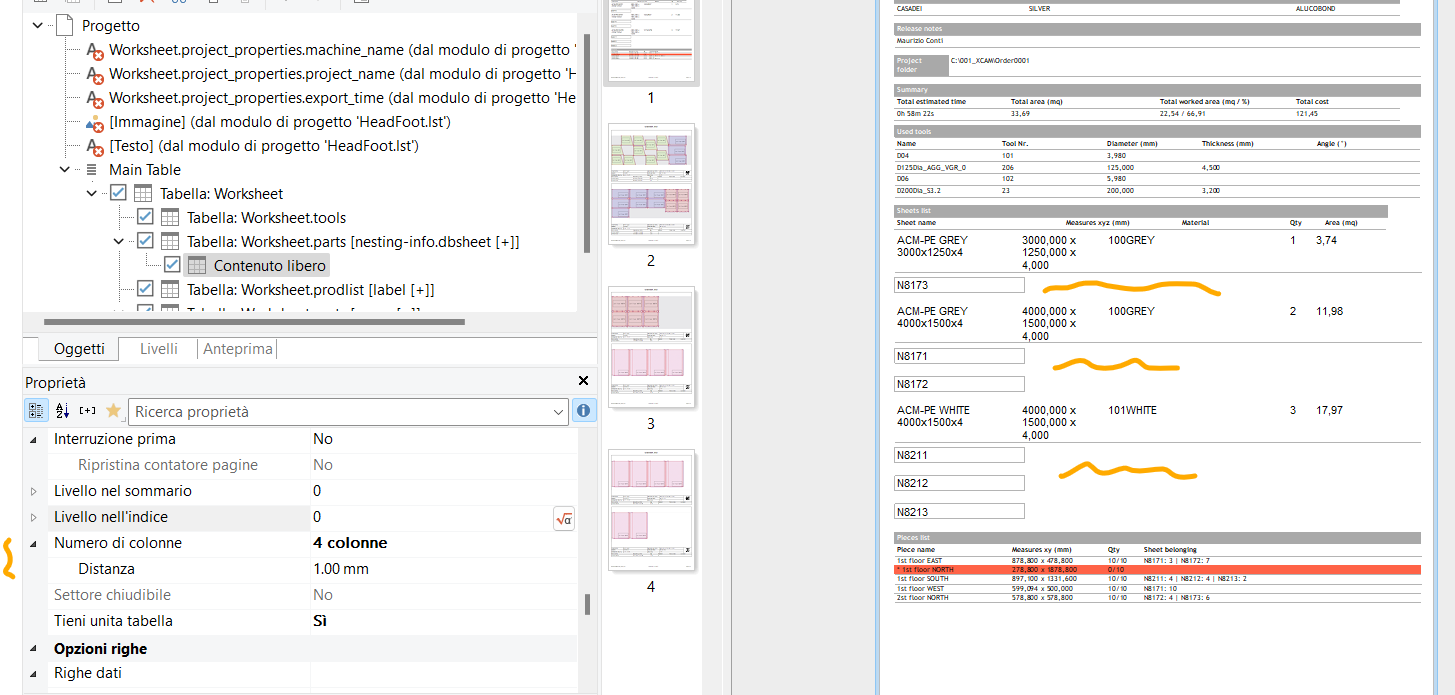
Are all NXXXX values printed within the “Contenuto libero” table? Or would this table always just contain a single value and the actually printed values result from a new revord in the Worksheet.parts table? In that case, you could check and set this table to 4 columns as well.
Multi-columnar child tables are always printed horizontally, that’s why the option is not present there . I’d suspect that you’re actually seeing the child table being printed once for each of the NXXXX values - which will prevent the feature from working as expected as this would require all values coming from one table print run.
Yes all NXXXX values are printed within the “Contenuto libero” table but that was just a test that I was attempting to.
I would just like to have an unique header line that shows the common information grouped by a key and the data lines after it aligned horizontally.
I already tried using the columns attribute directly on the main table (Worksheet.parts in the screenshot) but if I do like that, also the header is replicated (follows the columns number).
Is there a way to achieve the result I need?
Thank you,
Nicola.
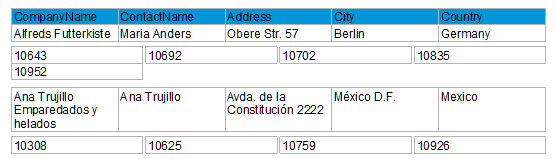
Attaching a project file for the demo application (“Reports”). Can you try to “destroy” it ? Do you see a difference to your approach? It currently renders the customers and then - from a sub table - the order numbers for the respective customer:
Thank you for the example,
I have seen it and understood the logic but our use case is different from the one in the file you sent.
We don’t have a filter relation in our table, our “main lines” are obtained by the groups header filter who is “summing” the lines having the same key.
The data lines that are shown after each group header should be represented horizontally while keeping the group header in a single column.
Do we need to change our fields/variables structure?
Thank you.
Nicola.
 . I’d suspect that you’re actually seeing the child table being printed once for each of the NXXXX values - which will prevent the feature from working as expected as this would require all values coming from one table print run.