In technical situations charts have a logarithmic x-axis (Frequency). It would be nice to create charts with logarithmic x and y-axis (sample: Bodediagramm)
Is this planned to be implemented, in particular for the X-axis?
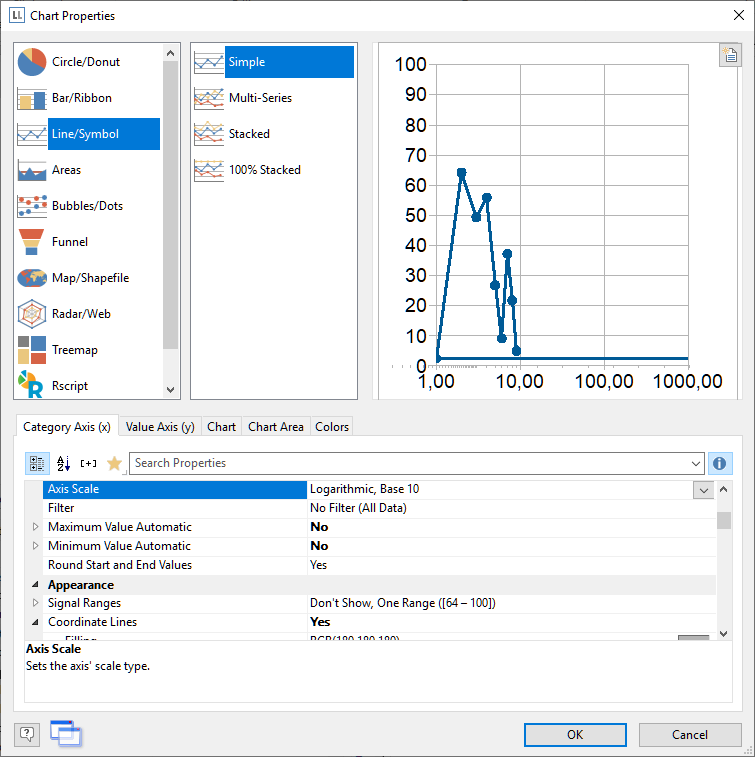
For the y-axis, this is already possible. For the x-axis, we’re currently evaluating to add this in LL25 for numeric axis values. I’ll keep this thread updated.
Just to give you an impression, this is the prototype currently running on my machine  - quite rough around the edges, the axis ticks need some tweaking, however it looks like this will work in the end.
1 Like
That’s looking very good. I would need it for Multi-Series…
1 Like
Should work automatically once it’s working at all  .
.
1 Like