is it possible to group fetched tabular data by a cell value that acts as a ID.
Column name may be ‘descriptor’ or ‘branch’.
Example data of rows:
id;numb;state;branch
1;223.00;A;group_a
2;3.00;D;group_b
3;87.00;D;group_a
4;123.00;A;out
5;10.00;A;out
6;54.21;A;old
I want to group them by the branch column and use that grouping in different tables.
One for giving a number of the count in each group, like:
Group_A: 2
Group_B: 1
out: 3
Another table with summarize numb values for each group, like:
Group_A: 320.00
Group_B: 3.00
out: 187.21
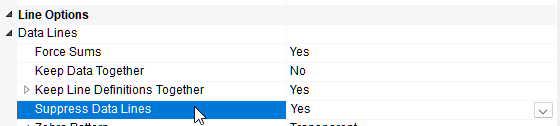
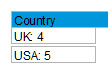
First of all you need to group by branch, then add a group footer and issue a Count(1,true) there. The second parameter resets the count once it’s output. I prepared a simple sample for our demo application, here I’m grouping the employees by Country and add a correspondig group footer: