Hello, I recently use your program and I am having some difficulties. I use the List & Label 20 Designer built-in in IbaAnalyzer 6.10.4.
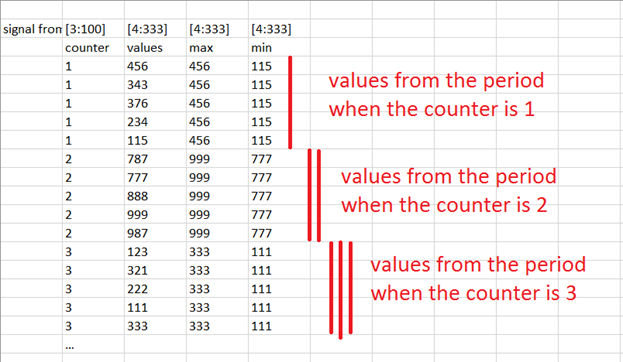
Question . I have a counter that changes depending on certain conditions during the recording of the signal. How to select values and carry out statistical changes over them from a 4: 333 signal from a time interval when the counter from a 3: 100 signal is 1, then when the counter is 2, 3 separately and write to one report table.
Here I would create a grouping in the table based on the counter, a Sumvariable can then be set there as a Group Sum.
Or set up 3 Sumvariables (if the count of counter is static) with the corresponding condition and then output/write them in the table.
1 Like