The reporting that I see in list and label seems to be for printing purposes only I don’t see any user interactivity in the graphs.
The user cannot zoom/focus/Isolate any part of the graph for analysis.
What options do I have If I want to implement a live dashboard to my clients can I do this in list and label.
Hello and Welcome!
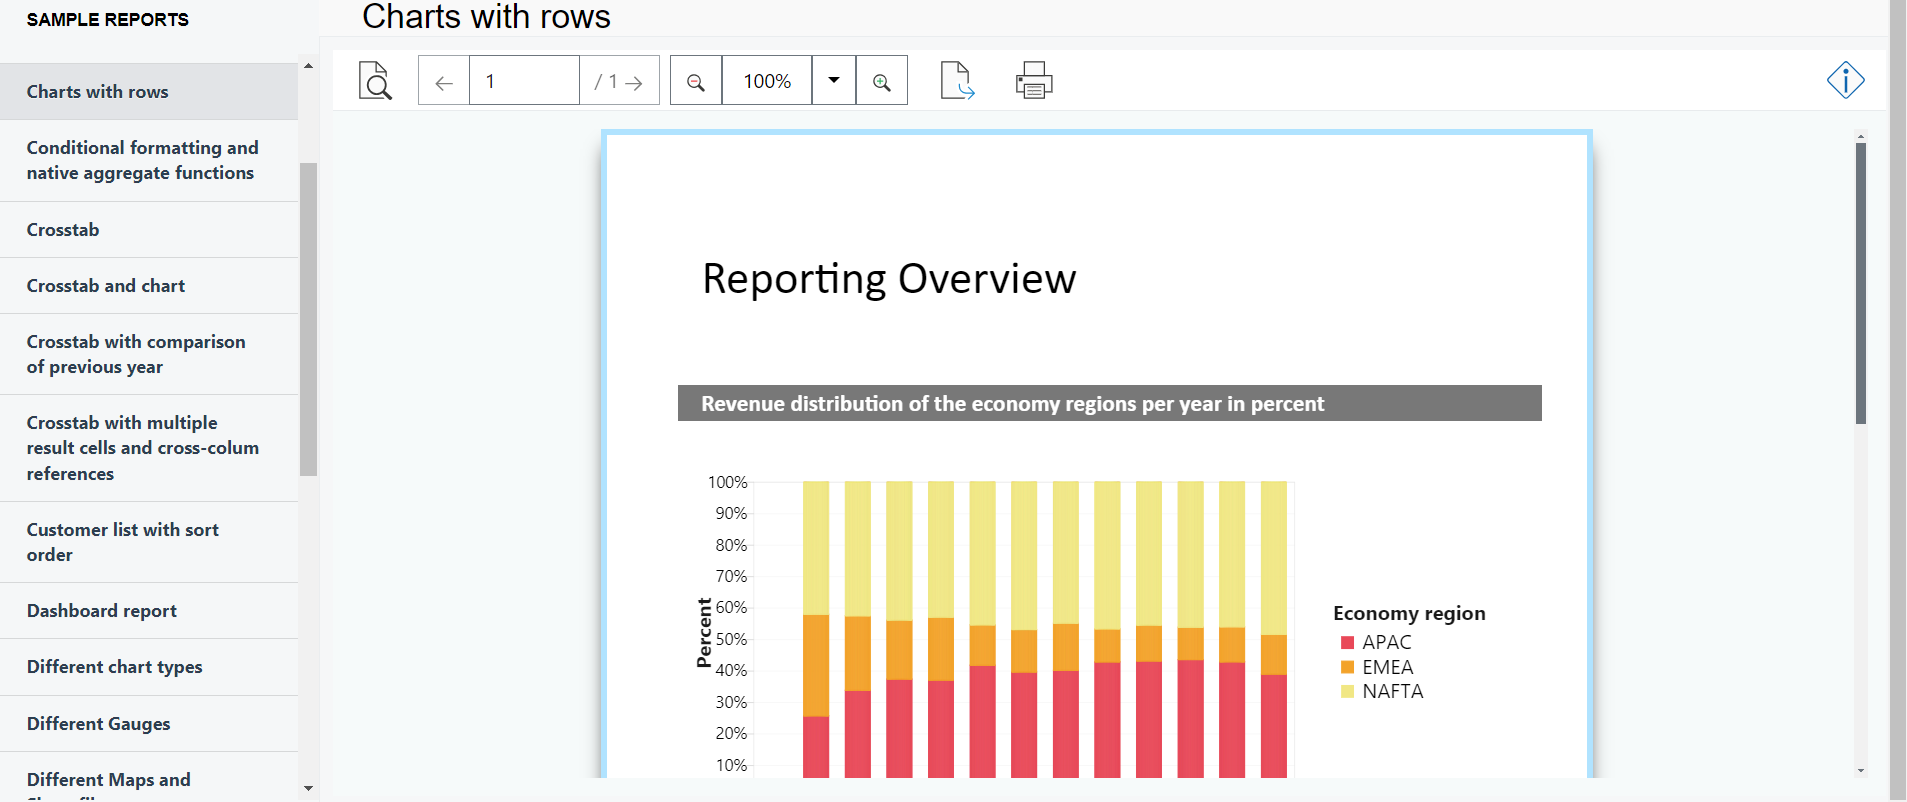
Your shot shows the web part of List & Label… but I would provide you this interesting article: Interactive Reports with List & Label | Reporting Blog
It is focused in the Windows desktop applications. But as I know just the from controls are currently not supported in the Web Report Viewer.
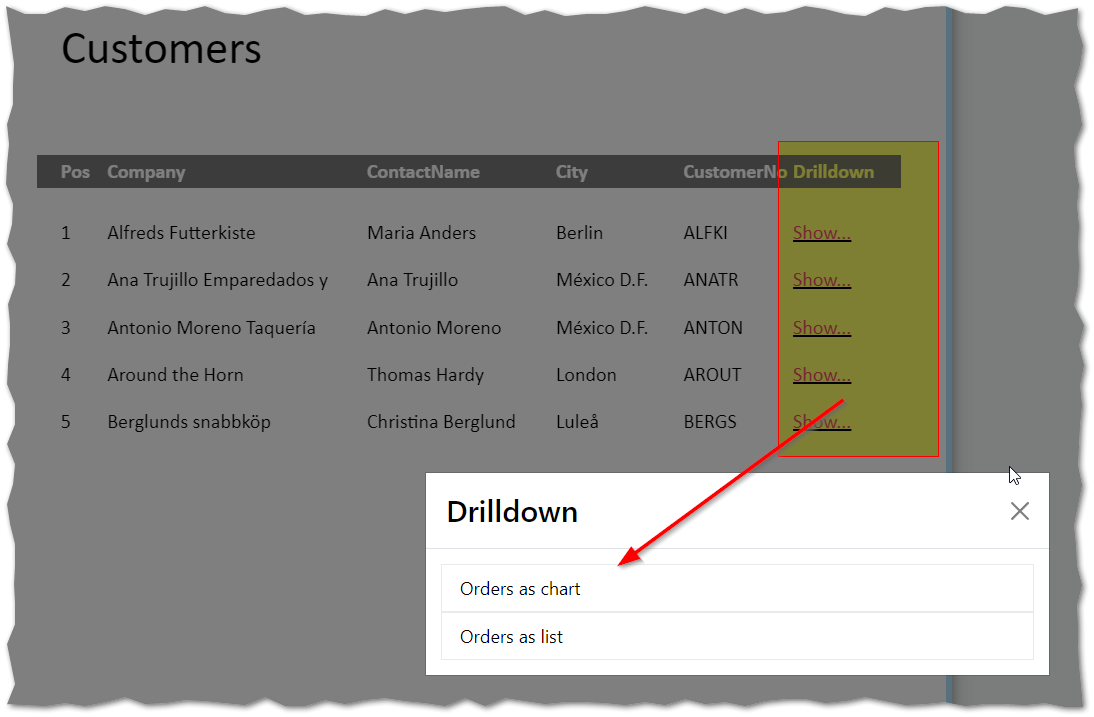
The online demo has some sample reports… this one is showing the drilldown function: Web Reporting List & Label